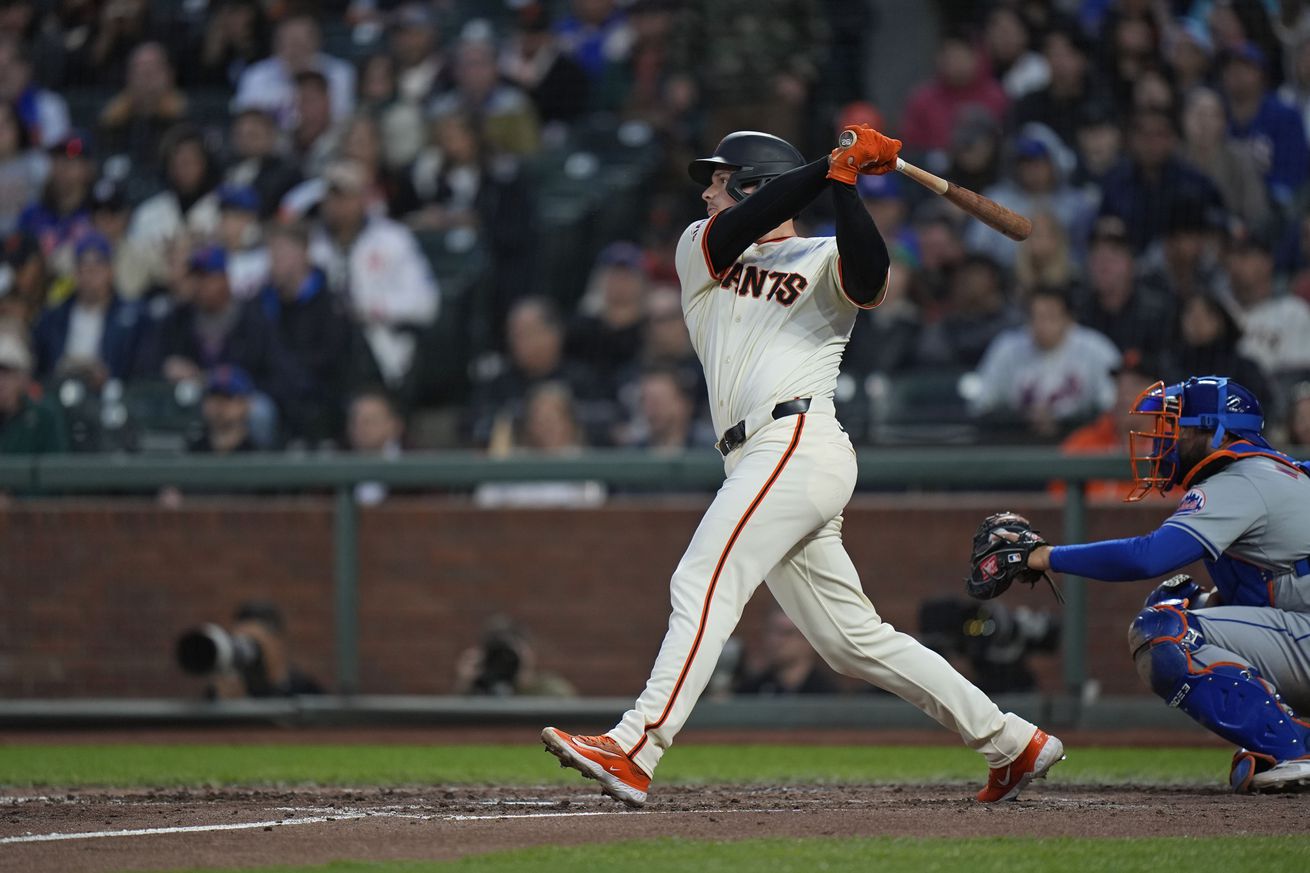
The eye test is beginning to match the data. That’s all any Baseball fan ask.
I’m going to throw a bunch of numbers at you, but please know that it’s all in service of proving that Matt Chapman is doing better now than his current season hitting line of .229/.277/.410 (.686 OPS) suggests.
His single off of David Bednar in last night’s wild one extended his hitting streak to 7 games. He’s 8-for-25 with 3 doubles during this streak which began when he was hitting .200/.256/400. And if you go back to the start of the Miami series, that’s a sample of 11 games for him. The San Francisco Giants are 7-4 in this stretch and he’s hitting .275/.310/.475 (.785 OPS).
Chapman’s batted ball data has been robust for most of the season, but with nearly a full month of games under the league’s belt, now we can contextualize those numbers. Folks, they are quite good. His 93 mph average exit velocity on batted balls is right in line with his career norms and his 48.8% Hard Hit rate is the 50th-best in MLB right now, sandwich comfortably between Bryce Harper (49.2%) and Mookie Betts (47.9%).
So, Chapman’s hitting the ball as hard as ever, but it seems like the knock on him has been that’s basically a Three True Outcomes guy (walks, strikeouts, dingers). His 5.4% walk rate right now is the lowest of his career outside of the COVID year (he’s usually around 10.5%) and the strikeouts are even down a bit (22.3% in 2024 vs. 27% for his career), so history isn’t really matching the present day. On the other hand, you like at Chapman’s at bats and they are mostly not terrible here in the past couple of weeks.
And yet his 2024 plate discipline numbers are in stark contrast to his career norms. He’s swinging the bat more than ever before and making contact more than ever. Take a look:
2017-2023: 42.7% Swing%, 74.3% Contact%
2024: 49.1% Swing%, 80.3% Contact%
That contact rate’s tied with Francisco Lindor, Freddie Freeman, and Corey Seager. Now, if you didn’t know, in 2023, Robert Orr for Baseball Prospectus quantified a whole new way to measure hitting skill with a SEAGER stat that measures pitch selection — basically, Corey Seager is the best player in Baseball at doing damage on hittable pitches thanks to selective aggression wherein he doesn’t let hittable pitches go by, as doing so creates the odds of a negative outcome for the hitter in a plate appearance.
Last season, Chapman was ranked 89th by this measure, and this season it looks like his increased swing percentage is tied to swinging at more pitches outside of the strike zone, which is bad because those are pitches hitters have less of a chance of doing damage against. His 34.6% outside of the zone swing percentage is a little bit greater than comparison point Seager’s (33.3%) and the 66% in-zone swing percentage is exactly in line with his career average.
Thankfully, we can examine this in a bit more detail thanks to FanGraphs, and if I’m to set the line of demarcation at the start of the Miami series rather than this 7-game hitting streak, then I get a pretty clear diagnosis of the situation: he’s being a bit more selective, probably because he’s starting to recognize how he’s being pitched by this new league.
First 70 PA: 52.3% Swing% (71.1% in zone, 34.8% out of zone), 79.9% Contact% (85.7% in-zone, 68.8% out of zone), 48.1% of the pitches were in the strike zone
Last 42 PA (incl. 7-game hitting streak): 44% Swing% (56.9% in zone, 34.4% out of zone), 81.1% Contact% (90.2% in zone, 69.7% out of zone), 42.9% of the pitches were in the strike zone
So, he’s toned down the free swinging a bit and it’s timed up nicely with the pitching approach towards him taking the first two weeks of his swing and miss and using that as a basis for throwing him fewer strikes. His bat is doing damage on hittable pitches, and so pitchers have opted to throw him fewer hittable pitches.
The trend won’t continue, of course, but until he demonstrates that it’s less dangerous for him to see strikes I expect it’ll continue for at least a little while longer, in which case Chapman’s confidence from success might grow. Remarkably, Aprils are usually great months for Chapman and Mays are terrible. We might see that flip this season if the past week or so is any indication.
We’re not quite out of the “Is this going to be Evan Longoria 2.0?” zone — though, you might’ve forgotten that he ended April 2018 with an .805 OPS — but all the visual cues that we’re seeing a healthy player simply working towards getting his bat going haven’t been a mirage. He’s on his way to putting up big numbers.